Formal Analysis
September 11 2001
Note added in 2009:
These analyses and descriptions were written in 2001, and we have in the meantime learned more. On the one hand, it is clear that the formal prediction for the deviation of means gives only part of the picture — the deviation that begins during this period apparently continues for two days. But our analysis of the poorly defined variance question can be much refined now, and a conservative reading suggests that measure is just marginally significant. 9/11 was a powerful event, but even so, should not be taken by itself as proof of a global consciousness effect — that requires the patient accumulation of replications.
The following material shows the behavior of the Global Consciousness Project’s network of 37 REG devices called eggs
placed around the world as they responded during the periods of time specified in formal predictions for the events of September 11 2001.
Deviation of Means
The Global Consciousness Project has a standard protocol for testing the hypothesis that great events in the world may affect the eggs in a way that can be detected by statistical analysis. The data from all the eggs are first combined in a single (Stouffer) Z-score representing the signed deviation of the mean across all eggs for each second. These Z-scores are squared and summed to yield a Chisquare for the whole period. The departure from expectation of this Chisquare reflects a correlated response across the eggs. Our prediction is for a positive deviation of the Chisquare, which would indicate a tendency toward increased deviations of the individual egg scores from theoretical expectation. More information about the analysis procedures is given in the Methodology section of the GCP Web site.
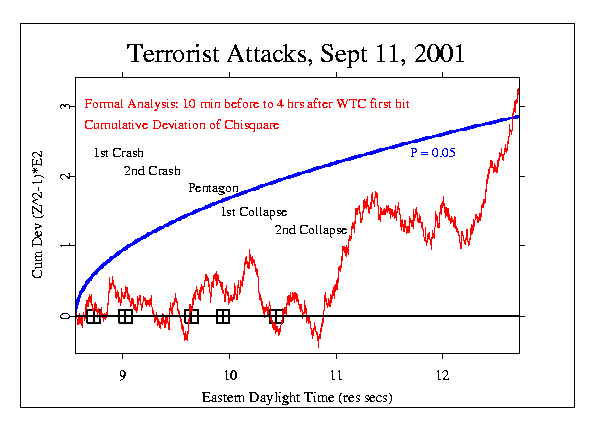
The first formal prediction for September 11 was essentially the same as that made for the terrorist bombing of American Embassies in Africa in August 1998. That specified a period beginning a few minutes before the bombing and included an aftermath period of three hours. Following that model, I specified a period beginning 10 minutes before the first plane crashed into the WTC tower, and ending four hours after, thus defining a similar aftermath period.
To visualize the data, we plot the cumulative deviation of the Chisquare sequence from chance expectation. If there is no effect, such a plot will show a random walk (sometimes called a drunkard’s walk
) around the horizontal line of expectation. That is, the trace will wander up and down but will have no clear trend.
The graph of data from the formal prediction for September 11 shows a fluctuating deviation throughout the moments of the five major events, during which ever-increasing numbers of people around the world are hearing the news and watching in stunned disbelief. Times of the major events are marked by boxes on the line of zero deviation. The uncertain fluctuation of the EGG data continues for almost half an hour after the fall of the second WTC tower. Then, at about 11:00, the cumulative deviation takes on a strong trend that continues through the aftermath period and ultimately exceeds the significance criterion. There were 37 eggs reporting on September 11, and over the 4 hours and 10 minutes of the prediction period, their accumlated Chisquare was 15332 on 15000 degrees of freedom. The final probability for the formal hypothesis test was 0.028, which is equivalent to an odds ratio of 35 to one against chance.

Deviation of Variance
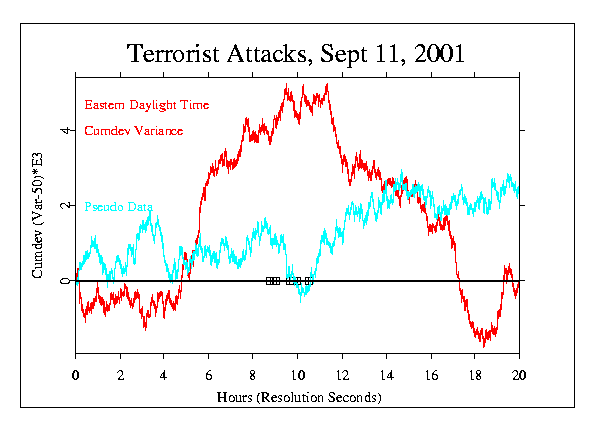
The next figure shows the cumulative deviation of a measure of the variability of scores (variance) among the 37 eggs over the course of the day of September 11. It was generated as a test of Dean Radin’s prediction that the variance would show strong fluctuations: I’d predict something like ripples of high and low variance, as the emotional shocks continue to reverberate for days and weeks.
Although this was only a partial specification it is effectively a prediction that the variance around the time of the disaster should deviate from expectation. I added the necessary specifications for a formal prediction.
The variance measure shows a normal fluctuation around the horizontal line of expectation until about three or four hours before the attack, and then a steep and persistent rise indicating a great excess of variance, continuing until about 11:00. Shortly thereafter, a long period begins during which the data show an equally precipitous decrease of variance. It is difficult to make a direct calculation of probability for this figure, but the extreme excursion in Dean Radin’s similar analysis reaches a level of more than three sigma, which corresponds to odds of less than 1 in 1000. An additional analysis using permutation of the data to determine how often such an extreme excursion occurs in randomly ordered sequences, to compare with the original temporal sequence leads to an estimate of p = 0.0048, based on 10,000 iterations. (A more recent computation using the mean of variance as the standard rather than theory yields p = 0.0009.)
A more conservative estimate is included in the formal database. It is based on assessing the fast rise and the fast fall of the variance measure surrounding the period of the attacks. The probability for each was calculated by extrapolation of the probability envelope as far (as many seconds) as would be needed to achieve the extreme rise or fall by chance, compared to the much shorter envelope that covers the time of the actual rise or fall. The ratios of these times were divided by the square root of 2 to compensate for the fact that a cumulative deviation trace reaching the terminal significance level at some prior time during the cumulation is twice as likely as the terminal probability itself. The resulting estimate is p = 0.096.
For a visual indication of the likelihood that this is merely a random fluctuation, a comparison can be made with pseudo-data generated for September 11, 2001, and plotted in the same format. In contrast to the real data, there are no long-sustained periods of strong deviation in the algorithmically generated data. This comparison with the pseudo-data indicates that the variance measure is unusual around the time of the attacks.
In this figure, the times on the X-axis are Eastern Daylight Time, allowing a direct assessment of the timing of the strong deviations. As in the first figure showing the cumulative deviation of the Chisquare, there is an indication that the effects registered for this horrendous event might have begun several hours prior to the first attack. Again, the pseudo data are used for a direct comparison. More on this topic, in the context of exploratory analyses, can be found on the 9/11 Variance page and on the extended analysis page.

Silent Prayer
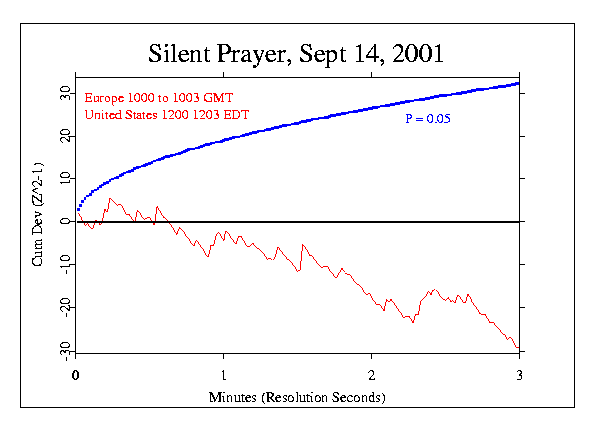
A third formal prediction was made with direct reference to the September 11 events. Since the horrible event, innumerable calls for prayer have been made. On the 14th of September there was a special emphasis on such collective spiritual moments, including major organized periods of silence in Europe and America. Doug Mast made a specific formal prediction for a deviation of the Chisquare over the time periods 1000 to 1003 GMT, corresponding to a European organized mourning and the time period 1200 to 1203 EDT (1600 to 1603 GMT) corresponding to the beginning of the Washington service and many organized mourning events in the Eastern US.
Here is the resulting graph.

The picture is compelling, although it does not confirm the formal prediction. Instead, the trend shows a marginally significant decrease in the deviations of the egg data. The Chisquare is 150.68 on 180 degrees of freedom, with probability 0.9455. The trend is steadily opposite to the specified direction.
More
Because this was an extraordinary event, we have done a great deal of contextual analysis. The questions asked are necessarily post hoc but our intention has been to determine what the data have to say, primarily by looking for structure in what should be truly random data. Our purpose has not been to prove
a point or to support a thesis, but instead to try to learn from the empirical indicators. The exploratory analysis page shows the main extensions beyond the formal analyses. An extended analysis page duplicates these and adds others that were part of the developing analysis program over the first few days following the tragedy. For more details about the project itself, you can go to the GCP home page where you will find links to all aspects.
