Hurricane Irma
The GCP technology is best suited for short, focused events. But occasionally it seems worthwhle to look at events that attract and hold attention from large numbers of people over longer periods. Many natural catastrophes are of this nature, at least in the sense their full development and the public understanding of their implications may take days.
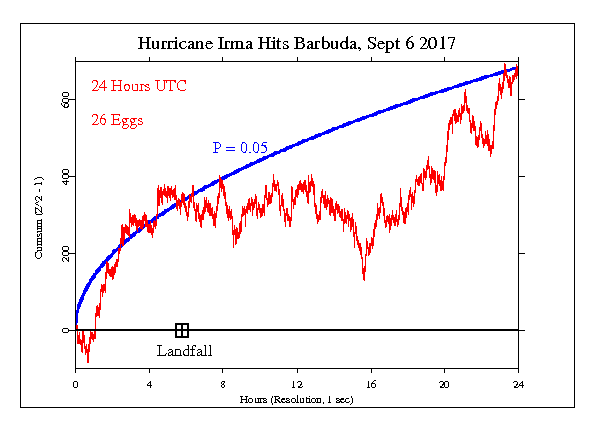
Hurricane Irma, which began growing early in September and by Sept 11 had run its course is an example. It made landfall on Sept 6 in the eastern Carribean when it damaged or destroyed 95% of the housing and other structures on the small island of Barbuda. The first image below shows the GCP data for that day, with the time of landfall indicated.
Over the next two days, Irma brushed by several larger islands including Puerto Rico, where the outlying winds from the huge storm did considerable damage. On the 9th of September, the eye of the hurricane made landfall on the north coast archipelago of Cuba, and continued hugging the coast for several hours, finally turning north around 5 pm. The second graph shows this day's data, with the approximate period of the destructive visitation to Cuba marked.
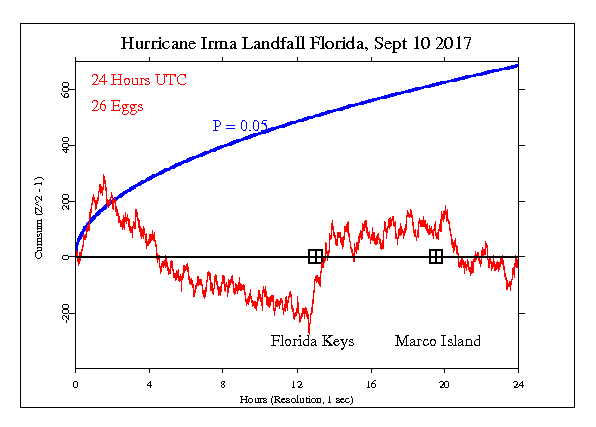
Florida was predicted to be the ultimate target of Irma's ferocity and already by mid afternoon Saturday, the winds and rain had become too strong for emergency services to be out. The predicted landfall time was 2 am Sunday (Sept 10) in the Florida Keys, with expectation the eye would track up the length of the peninsula. But Irma slowed in its northward path and the track also moved westward. The first landfall on Florida was about 9:00 am hitting the Florida Keys with category 4 strength. Then the slow movement continued, with the mainland landfall on the west coast at Marco Island about 3:30 pm. The storm is so big that all of the state has been affected, with heavy hurricane force winds extending 70 miles from the center and a storm surge of several feet expected for all of the coast around the tip of Florida. The third figure below shows this day (the UTC day of Sept 10). The two landfall times are noted. There is a particularly sharp inflection at about the time the eye hit the Keys.
Specific Hypothesis and Results
All this is an exploration, with probes intended to capture something of the intense attention given to the storm. There is no formal hypothesis, but the usual expectation of a positive deviation during periods when large numbers of people have the same emotions and thoughts in communion.
Interpretation
The following graph is a visual display of the statistical result. It shows the second-by-second accumulation of small deviations of the data from what’s expected. Our prediction is that deviations will tend to be positive, and if this is so, the jagged line will tend to go upward. If the endpoint is positive, this is evidence for the general hypothesis and adds to the bottom line. If the endpoint is outside the smooth curve showing 0.05 probability, the deviation is nominally significant. If the trend of the cumulative deviation is downward, this is evidence against the hypothesis, and is subtracted from the bottom line. For more detail on how to interpret the results, see The Science and related pages, as well as the standard caveat below.


Standard caveat
It is important to keep in mind that we have only a tiny statistical effect, so that it is always hard to distinguish signal from noise. This means that every success
might be largely driven by chance, and every null
might include a real signal overwhelmed by noise. In the long run, a real effect can be identified only by patiently accumulating replications of similar analyses.
