Berlin Christmas Market Truck Terror Attack
From The Telegraph:
A lorry ploughed into a crowded Christmas market in central Berlin on Monday evening, killing 12 people and injuring 48 others, some seriously, in what Germany's interior minister said looked like an 'attack' rather than an accident.
The original driver of the truck, which appeared to have been stolen from a construction site in Poland, appears to have been shot before the attack took place, according to the interior minister for the state of Brandenburg.
At 3pm local time (14:00GMT) the Polish transport company owner of the lorry lost contact its driver. The company's transport manager, Lukasz Wasik, said the driver, who is the owner's cousin, had been transporting Thyssen steel products from Italy to Berlin. "The company where he was supposed to unload the products in Berlin was not able to receive them and told him to return on Tuesday morning. They told him to wait in Berlin somewhere," Wasik told AFP. "We lost contact with him around 3:00 pm local time. We don't know what happened - whether he was taken hostage, killed. We know nothing. We're very worried about him."
Around 8pm local time the lorry drove into the busy Christmas market. Police said the vehicle made it as far as 80 metres (yards) into the Christmas market before it came to a halt killing 12 and injuring 48 people in the process. One of the people killed was a Polish man who was inside the lorry, police clarified that he was not the person in control of the vehicle.
Specific Hypothesis and Results
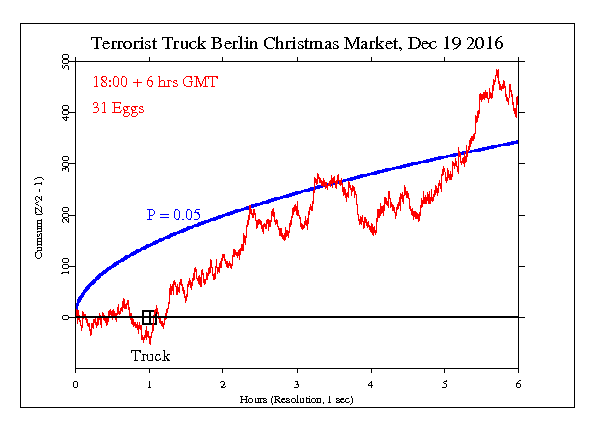
The hypothesis was set for a 6 hour period beginning at 7 pm local (18:00-24:00 GMT). This covers an hour before the truck entered the market, and 5 hours of aftermath. The result is Chisquare 22026 on 21600 df, for p = 0.020589 and Z = 2.0417. The data show a strong deviation from expectation throughout the time period beginning as the truck plowed into the holiday crowd.
Interpretation
The following graph is a visual display of the statistical result. It shows the second-by-second accumulation of small deviations of the data from what’s expected. Our prediction is that deviations will tend to be positive, and if this is so, the jagged line will tend to go upward. If the endpoint is positive, this is evidence for the general hypothesis and adds to the bottom line. If the endpoint is outside the smooth curve showing 0.05 probability, the deviation is nominally significant. If the trend of the cumulative deviation is downward, this is evidence against the hypothesis, and is subtracted from the bottom line. For more detail on how to interpret the results, see The Science and related pages, as well as the standard caveat below.

Standard caveat
It is important to keep in mind that we have only a tiny statistical effect, so that it is always hard to distinguish signal from noise. This means that every success
might be largely driven by chance, and every null
might include a real signal overwhelmed by noise. In the long run, a real effect can be identified only by patiently accumulating replications of similar analyses.
