Obama Rally, Chester PA, Oct 28 2008 |
|
I set up a Psyleron REG with the Fieldreg program before driving to Chester PA to be at the Obama Rally on Oct 28 2008. My original thought was to carry a FieldREG mounted to a palmtop, following the original PEAR lab protocol as used in concerts, rituals, meetings and occasions like the Egypt tour. However, I did not have a working unit (most probably would not have been allowed to take it through security anyway without prior arrangement.) So I decided to do a "Remote FieldREG" recording, using the Psyleron on a laptop in my office. Such remote recording was explored in a few efforts while at PEAR, and indeed they are part of the background for expanding the FieldREG protocol to multiple REGs and global distances to create the GCP network. I left very early, having set the FieldREG program at 04:00, using 200-bit trials at one per second. When I returned home, I shut down the program at 15:23 and opened the analysis facility. It showed the following graph of the data collected during 11 hours 23 minutes beginning at 4:00 am local time. (Full size here)
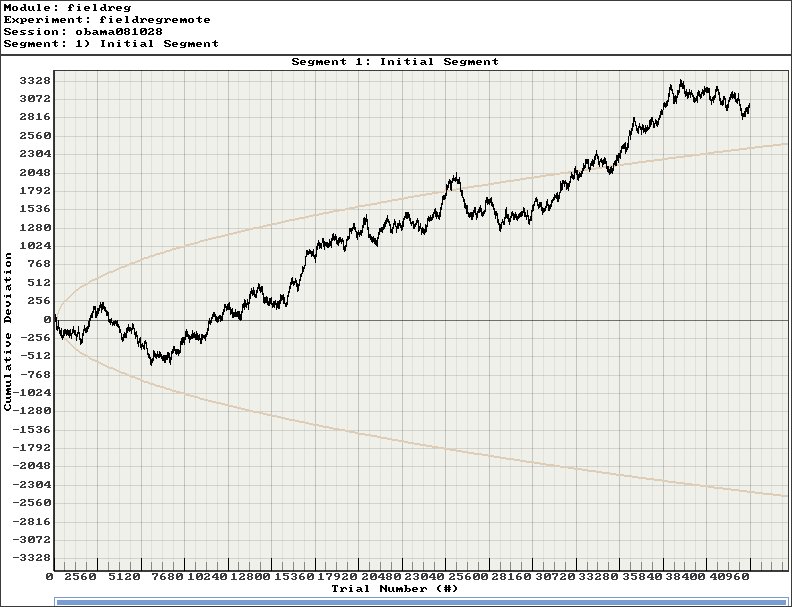
I then exported the data file to my workstation and stripped out the trial values, which are 200-bit sums. I plot these as the cumulative deviation of Z, which is different from the GCP procedure (We use Z-squared because are interested in variance, and want the mathematical composition simplicity of Chisquare). The plot is the same, but I can also notate where the interesting points are. The starting point at 0 is 04:00, I arrived about 06:30, and the gates (security) opened at 08:00 (4 on the axis label). I also could extract and process data corresponding to the talk itself, as shown in the second graph below.
There were several "warmup" talks including a few minutes from Governer Rendell wearing a Phillies cap and jacket. The crowd was big, and pretty happy despite the cold rain and the long wait. Obama began speaking at 10:00, and probably spoke for about half an hour, maybe a little less out of consideration for the weather. Here is the data segment from 10:00 to 10:30. It corresponds to the upslope of the notable "hump" in the previous figure.
It is interesting also to look at the Chisquare version. It shows lots of activity, including during the talk, but no persistent trend. There is a very strong slope after the talk for a couple of hours, a period that typically would be included in a formal prediction of the GCP.
For a formal look at GCP effects associated with Barack Obama, I did a prediction for the acceptance speech at the Democratic convention. It is in the Formal Results table as event #271. McCain is #272. The difference (overinterpreting wildly) looks like evidence for an "experimenter effect" due to my personal admiration for Obama and my hope he will succeed. But there is no testable way to determine that it is not what it appears to be -- an effect of coherent consciousness of large groups. In the meantime, we have done several other formal events associated with Obama, and these are summarized in a page called The Obama Effect. It is important to keep in mind that we have only a tiny statistical effect, so that it is always hard to distinguish signal from noise. This means that every "success" might be largely driven by chance, and every "null" might include a real signal overwhelmed by noise. In the long run, a real effect can be identified only by patiently accumulating replications of similar analyses.
|