Solar Eclipse, 2017
From https://www.timeanddate.com/eclipse/solar/2017-august-21
The total solar eclipse of August 21, 2017 will be visible from a narrow path spanning the US from the West Coast to the East Coast. Here are all the facts you need to know about this once-in-a-lifetime event. The August 21, 2017 total solar eclipse will be a rare and spectacular sight.
Most North Americans Will Be Able To See Totality ...if they are willing to drive that is. The total eclipse will only be visible along the Moon's central shadow, which at its widest will be about 115 kilometers (71.5 miles), according to some sources. Its path will span from the country's West Coast to the East Coast. The rest of North America, as well as Central America and northern parts of South America, will experience a partial solar eclipse. NASA has estimated that a majority of the American population lives less than a 2-day drive away from the path of totality.
The Yaquina Head Lighthouse in Newport, Oregon will be the first location on continental US soil to see totality. The partial phase of the eclipse will begin here at 9:04 am local time.
After Oregon, the eclipse will move through Idaho, Wyoming, Nebraska, Kansas, Missouri, Illinois, Kentucky, Tennessee, North Carolina, Georgia, and South Carolina. Montana and Iowa are the only states where the path of totality will pass through unpopulated areas. People in Charleston, South Carolina will be some of the last people in the US to see totality.
Specific Hypothesis and Results
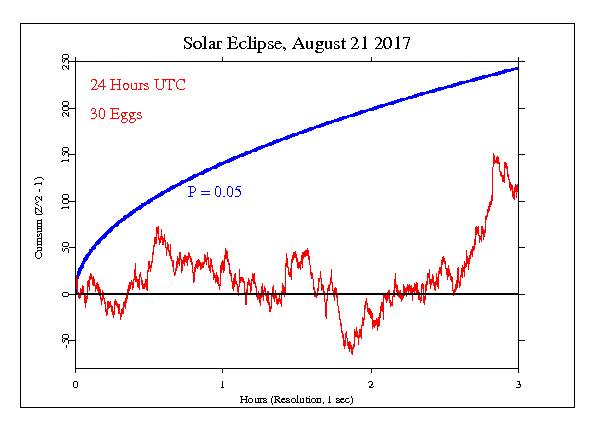
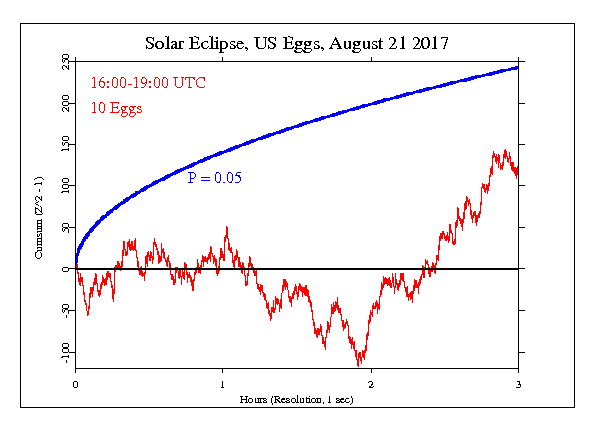
The GCP exploratory hypothesis will look at the three hour period from 09:00 PDT to 3 pm EDT, which corresponds to 16:00 to 19:00 UTC. As we did for the August 1999 Eclipse, we examined both the full network and the subset of Eggs in the shadow path over the US. The result is similar in both cases with a level trend for about two hours followed by a strong upward trend. In both cases the terminal value of Z is about 0.8.
Interpretation
The following graph is a visual display of the statistical result. It shows the second-by-second accumulation of small deviations of the data from what’s expected. Our prediction is that deviations will tend to be positive, and if this is so, the jagged line will tend to go upward. If the endpoint is positive, this is evidence for the general hypothesis and adds to the bottom line. If the endpoint is outside the smooth curve showing 0.05 probability, the deviation is nominally significant. If the trend of the cumulative deviation is downward, this is evidence against the hypothesis, and is subtracted from the bottom line. For more detail on how to interpret the results, see The Science and related pages, as well as the standard caveat below.

Looking at the US subset
The following figure shows the cumulative deviation of the data for the subset of 10 eggs in the US. Most or all of them were in the path of the moon's shadow.

Standard caveat
It is important to keep in mind that we have only a tiny statistical effect, so that it is always hard to distinguish signal from noise. This means that every success
might be largely driven by chance, and every null
might include a real signal overwhelmed by noise. In the long run, a real effect can be identified only by patiently accumulating replications of similar analyses.
